You have deployed an application to Kubernetes. The pods run, the Service answers, every check is green. Then traffic doubles, a certificate expires, a release breaks, a node dies or someone runs a privileged container. Kubernetes schedules and restarts containers well. It does not package your application, keep the cluster equal to Git, explain a slow pod, add nodes, encrypt service-to-service traffic, renew certificates, enforce your rules or back anything up.
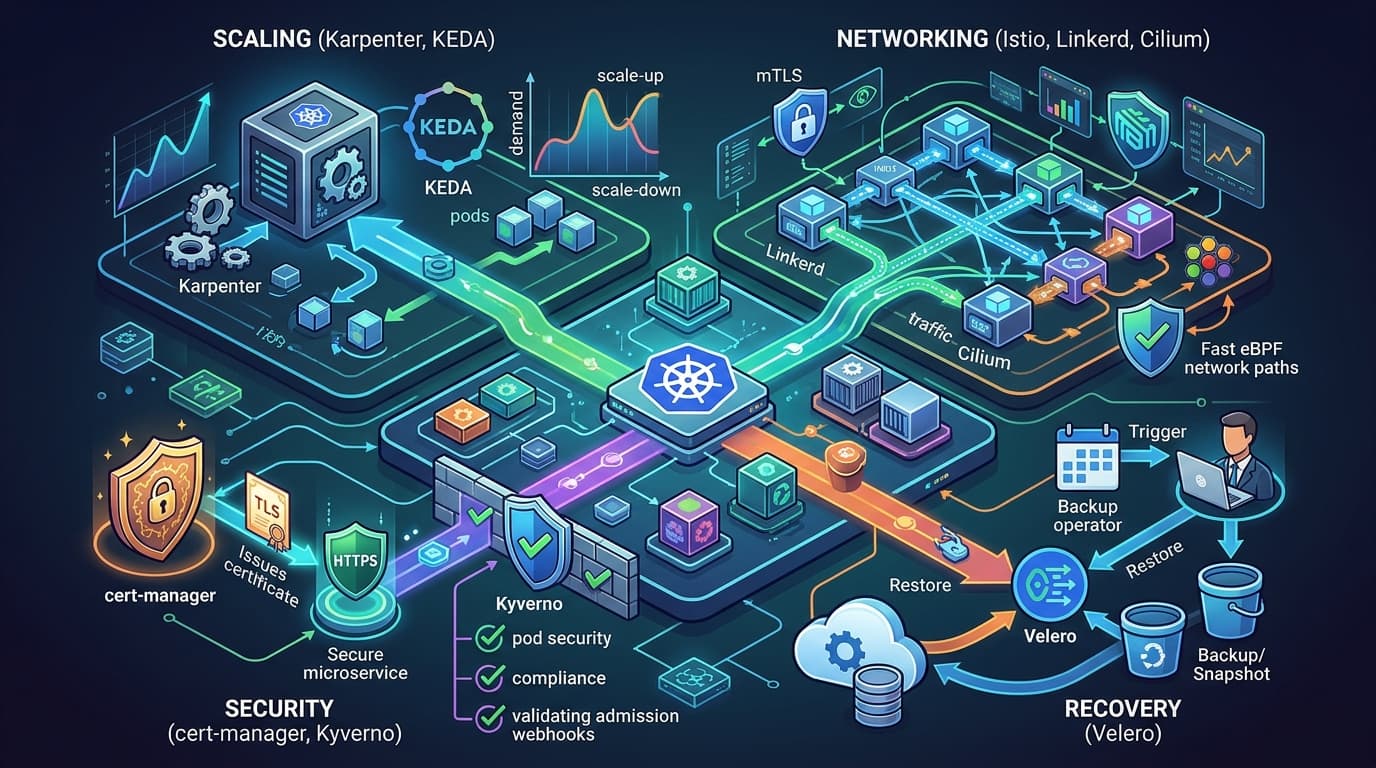
The Kubernetes tools DevOps engineers use fill those gaps, and most come from the CNCF ecosystem. This two-part series covers 15 of them. Part 1 is about getting software into a cluster and seeing what it does: Helm, Argo CD, Flux, Kustomize, K9s, Lens and Prometheus. Part 2 covers scaling, networking, security and recovery.
You do not need all 15. Several compete (Argo CD or Flux, Istio or Linkerd), and every controller you add is one more thing to upgrade and debug.
How I checked this, on 8 November 2026. Versions are the latest stable releases on each project's GitHub page, and CNCF status comes from cncf.io. Every YAML manifest was validated against the project's CRD schema at that version or the Kubernetes v1.37 API, the Kustomize overlay was built, and the PromQL ran against a real Prometheus. The verification script is public. Lab facts come from my repositories and a read-only look at my cluster; proposals are labelled.
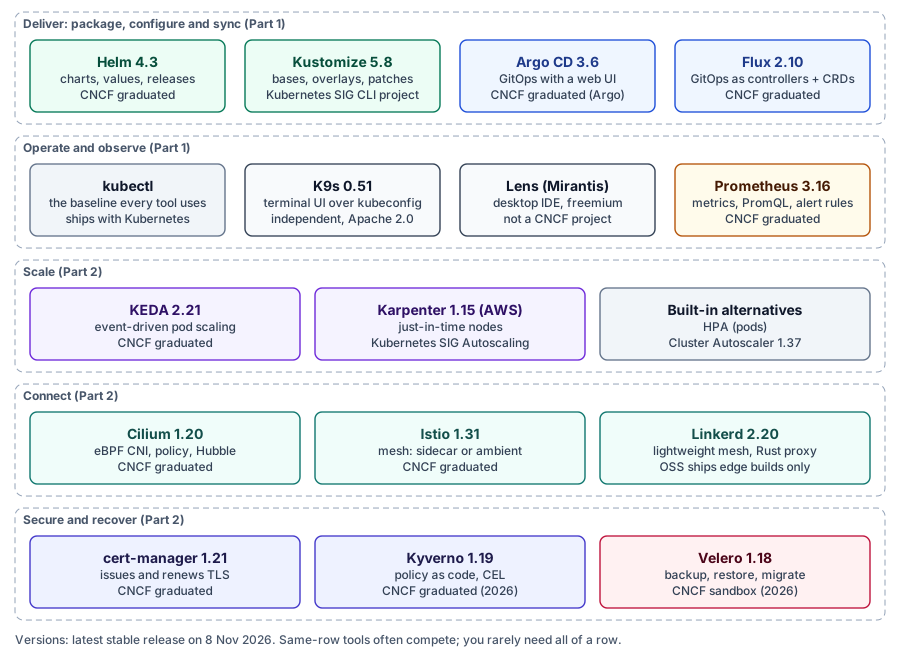
The 15 tools at a glance
| Tool | Category | Primary purpose | Alternatives | Part |
|---|---|---|---|---|
| Helm 4.3 | Packaging | Versioned app packages | Kustomize | 1 |
| Argo CD 3.6 | GitOps | Git-to-cluster sync with a UI | Flux | 1 |
| Flux 2.10 | GitOps | Git-to-cluster sync as controllers | Argo CD | 1 |
| Kustomize 5.8 | Configuration | YAML overlays per environment | Helm | 1 |
| K9s 0.51 | Operations | Terminal troubleshooting | kubectl | 1 |
| Lens | Operations | Desktop cluster IDE | Headlamp | 1 |
| Prometheus 3.16 | Observability | Metrics and alerting | Managed metrics | 1 |
| Karpenter 1.15 | Autoscaling | Node provisioning | Cluster Autoscaler | 2 |
| KEDA 2.21 | Autoscaling | Event-driven pod scaling | HPA | 2 |
| Istio 1.31 | Service mesh | mTLS and traffic control | Linkerd | 2 |
| Linkerd 2.20 | Service mesh | Lightweight mTLS and metrics | Istio | 2 |
| Cilium 1.20 | Networking | eBPF CNI and policy | Calico | 2 |
| cert-manager 1.21 | Security | TLS automation | Cloud certificate services | 2 |
| Velero 1.18 | Backup | Backup and restore | Cloud backup services | 2 |
| Kyverno 1.19 | Policy | Admission policies | OPA Gatekeeper | 2 |
Tools in different categories are not substitutes: Helm and Argo CD work together, and Prometheus does not replace a log store.
1. Helm: the Kubernetes package manager
What and why. A real application is a dozen YAML files whose names, tags and sizes change per environment. Helm, a CNCF graduated project, packages them as a chart: templates, a values.yaml of defaults and a Chart.yaml with version and dependencies. Most third-party software ships as a chart, so Helm is usually the first tool you meet.
How it works. Helm renders Go templates with your values on the client, applies the result, and records a release revision as a Secret (sh.helm.release.v1.<name>.v<N>). upgrade writes revision N+1, and rollback re-applies an older revision as a new one. Helm 4 uses server-side apply for new installs and renamed --atomic to --rollback-on-failure and --force to --force-replace. The old flags still work with a warning.
helm repo add prometheus-community https://prometheus-community.github.io/helm-charts
helm repo update
helm install monitoring prometheus-community/kube-prometheus-stack \
  --namespace monitoring \
  --create-namespace

helm upgrade monitoring prometheus-community/kube-prometheus-stack \
  -n monitoring -f values-prod.yaml --rollback-on-failure
helm history monitoring -n monitoring      # every revision and its status
helm rollback monitoring 3 -n monitoring   # re-apply revision 3 as a new revision
helm template monitoring prometheus-community/kube-prometheus-stack -f values-prod.yaml > rendered.yaml
helm template renders without touching the cluster, which is the best way to review a values change.
With Argo CD, Helm only renders. Argo CD applies the output itself and keeps no Helm release, so helm list shows nothing for that app. ServerSideApply=true is needed here because this chart's CRDs are too large for client-side apply.
apiVersion: argoproj.io/v1alpha1
kind: Application
metadata:
  name: monitoring
  namespace: argocd
spec:
  project: default
  source:
    repoURL: https://prometheus-community.github.io/helm-charts
    chart: kube-prometheus-stack
    targetRevision: 93.1.0
    helm:
      releaseName: monitoring
      valuesObject:
        grafana:
          enabled: true
        prometheus:
          prometheusSpec:
            retention: 15d
  destination:
    server: https://kubernetes.default.svc
    namespace: monitoring
  syncPolicy:
    syncOptions:
      - CreateNamespace=true
      - ServerSideApply=true
Limits. Templated YAML is hard to read, and big charts expose hundreds of values. Helm installs a chart's crds/ only on first install: there is "no support at this time for upgrading or deleting CRDs using Helm", so upgrade CRDs separately. Use it for upstream software and apps with many knobs; for one app with two environments, Kustomize is lighter. Docs: helm.sh/docs.
2. Argo CD: GitOps continuous delivery
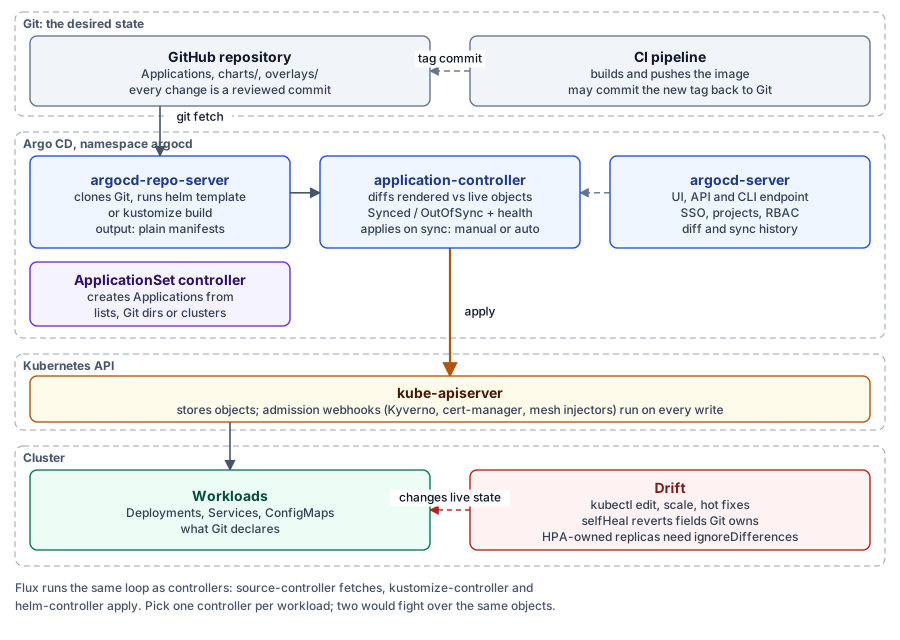
What and why. Pipelines that run kubectl apply need cluster credentials in CI, and nobody notices drift. GitOps reverses the direction: a controller inside the cluster pulls Git and makes the cluster match. Argo CD, part of the CNCF graduated Argo project, does this with a full web UI.
How it works. An Application (a CRD) points at a Git path or chart and a destination. The repo-server renders plain YAML, Kustomize or Helm. The application-controller compares the result with live objects and reports sync status (Synced, OutOfSync) and health (Healthy, Progressing, Degraded, Missing) separately. Owned objects carry an argocd.argoproj.io/tracking-id annotation.
apiVersion: argoproj.io/v1alpha1
kind: Application
metadata:
  name: shop-web
  namespace: argocd
  finalizers:
    - resources-finalizer.argocd.argoproj.io
spec:
  project: default
  source:
    repoURL: https://github.com/example-org/platform-config.git
    targetRevision: main
    path: apps/shop-web/overlays/production
  destination:
    server: https://kubernetes.default.svc
    namespace: shop
  syncPolicy:
    automated:
      prune: true
      selfHeal: true
    syncOptions:
      - CreateNamespace=true
      - RespectIgnoreDifferences=true
  ignoreDifferences:
    - group: apps
      kind: Deployment
      jsonPointers:
        - /spec/replicas
selfHeal reverts manual edits and prune deletes what you removed from Git. ignoreDifferences on /spec/replicas, together with RespectIgnoreDifferences=true, stops Argo CD fighting an HPA or KEDA. An ApplicationSet stamps out Applications from a generator (a list, Git directories or every registered cluster), which is how one definition covers staging, production or fifty clusters:
apiVersion: argoproj.io/v1alpha1
kind: ApplicationSet
metadata:
  name: shop-web
  namespace: argocd
spec:
  goTemplate: true
  goTemplateOptions: ["missingkey=error"]
  generators:
    - list:
        elements:
          - env: staging
            server: https://kubernetes.default.svc
          - env: production
            server: https://prod.k8s.example.com
  template:
    metadata:
      name: "shop-web-{{.env}}"
    spec:
      project: default
      source:
        repoURL: https://github.com/example-org/platform-config.git
        targetRevision: main
        path: "apps/shop-web/overlays/{{.env}}"
      destination:
        server: "{{.server}}"
        namespace: shop
      syncPolicy:
        syncOptions:
          - CreateNamespace=true
Clusters, access and secrets. argocd cluster add <context> registers a cluster. AppProjects restrict repositories and destinations, RBAC restricts who may sync, and SSO uses the bundled Dex or any OIDC provider. Argo CD does not manage secrets: use External Secrets Operator, Sealed Secrets or SOPS.
Statuses you will see. OutOfSync means Git and the cluster differ (normal after a commit with manual sync). Missing means an object in Git does not exist. Degraded means it exists but is unhealthy. A sync failure means the API server rejected an apply: a webhook, a missing CRD or RBAC. Argo CD holds strong credentials for every cluster it manages, so treat its UI and API as attack surface. Docs: argo-cd.readthedocs.io.
3. Flux: the GitOps toolkit
What and why. Flux, also CNCF graduated, does the same job as a set of small controllers driven by CRDs and the flux CLI, with no built-in UI.
How it works. The source-controller fetches Git, Helm and OCI sources. The kustomize-controller applies paths, and the helm-controller runs real Helm releases. The notification and image-automation controllers send events and can commit new image tags.
flux check --pre
flux bootstrap github --owner=example-org --repository=platform-config \
  --branch=main --path=clusters/production --personal
flux get kustomizations
flux reconcile kustomization shop-web --with-sourceapiVersion: source.toolkit.fluxcd.io/v1
kind: GitRepository
metadata:
name: platform-config
namespace: flux-system
spec:
interval: 1m
url: https://github.com/example-org/platform-config
ref:
branch: main
---
apiVersion: kustomize.toolkit.fluxcd.io/v1
kind: Kustomization
metadata:
name: shop-web
namespace: flux-system
spec:
interval: 10m
sourceRef:
kind: GitRepository
name: platform-config
path: ./apps/shop-web/overlays/production
prune: true
wait: true
timeout: 5mapiVersion: source.toolkit.fluxcd.io/v1
kind: HelmRepository
metadata:
name: prometheus-community
namespace: flux-system
spec:
interval: 1h
url: https://prometheus-community.github.io/helm-charts
---
apiVersion: helm.toolkit.fluxcd.io/v2
kind: HelmRelease
metadata:
name: monitoring
namespace: monitoring
spec:
interval: 30m
chart:
spec:
chart: kube-prometheus-stack
version: "93.1.0"
sourceRef:
kind: HelmRepository
name: prometheus-community
namespace: flux-system
install:
crds: CreateReplace
upgrade:
crds: CreateReplace
values:
prometheus:
prometheusSpec:
retention: 15d| Argo CD | Flux | |
|---|---|---|
| UI | Full web UI | CLI and CRDs |
| Model | Central repo-server renders | One controller per job |
| Multi-tenancy | AppProjects, Argo RBAC, SSO | Kubernetes RBAC, per-Kustomization ServiceAccounts |
| Helm | Renders only | Real Helm releases |
Both are mature, so choose by workflow. Never run both on the same objects: each would revert the other. Flux for the platform and Argo CD for apps is fine if no object has two owners. Docs: fluxcd.io/flux.
4. Kustomize: configuration without templates
What and why. Kustomize, a Kubernetes SIG CLI project built into kubectl, takes valid YAML (the base) and applies overlays per environment: patches, namespace, image tags, labels and generated ConfigMaps. No template language.
apiVersion: kustomize.config.k8s.io/v1beta1
kind: Kustomization
resources:
  - deployment.yaml
  - service.yaml
labels:
  - pairs:
      app.kubernetes.io/part-of: shop
configMapGenerator:
  - name: shop-web-config
    literals:
- LOG_LEVEL=infoapiVersion: kustomize.config.k8s.io/v1beta1
kind: Kustomization
namespace: shop
resources:
- ../../base
images:
- name: registry.example.com/shop/web
newTag: "1.5.0"
patches:
- path: replicas.yaml
configMapGenerator:
- name: shop-web-config
behavior: merge
literals:
- LOG_LEVEL=warnapiVersion: apps/v1
kind: Deployment
metadata:
name: shop-web
spec:
replicas: 3
template:
spec:
containers:
- name: web
resources:
requests:
cpu: 250m
memory: 256Mi
limits:
memory: 512Mikubectl kustomize overlays/production # render and review
kubectl diff -k overlays/production # compare with the cluster
kubectl apply -k overlays/productionThe generator appends a content hash to the ConfigMap name and rewrites references, so a config change rolls the Deployment. Built for this article, the overlay renders 3 replicas, tag 1.5.0, namespace shop and LOG_LEVEL=warn.
Helm or Kustomize? Helm to consume third-party software and for apps with many options; Kustomize for your own manifests with small per-environment differences. They combine: patch a rendered chart, or let Argo CD or Flux do both. Kustomize has no logic by design, and the copy in kubectl can lag the standalone release. Docs: kubectl.docs.kubernetes.io.
5. K9s: the Kubernetes terminal UI
What and why. Typing get, describe, logs and exec in a loop is slow during an incident. K9s (Apache 2.0) is a terminal UI that watches the cluster live through your kubeconfig.
| Keys | Action |
|---|---|
:pods, :deploy, :events | Jump to a resource view |
:ns, :ctx, 0 | Namespace, cluster, all namespaces |
/text | Filter |
d, y, e | Describe, YAML, edit |
l, s | Logs, shell |
Shift-f | Port-forward |
Ctrl-k, Ctrl-d | Kill pod, delete resource |
:xray deploy, :pulses | Dependency tree, activity summary |
A typical loop: :pods, filter to the app, sort by restarts, d for the last state and events, then l with previous logs to see why the container died.
Security. K9s can do exactly what your kubeconfig's RBAC allows. For on-call engineers who only look, bind the view ClusterRole and run k9s --readonly. Docs: k9scli.io.
6. Lens: the Kubernetes desktop IDE
What and why. Lens, by Mirantis, is a desktop app that shows clusters as resource trees with logs, terminals, metrics and Helm management. It suits people who prefer a GUI across many clusters.
Licensing (Lens pricing page, November 2026). Personal is free "for students, hobbyists, and engineers at small organizations"; organisations above $10 million revenue or funding need a paid plan after 30 days. Plus is $25 a month billed yearly; Pro and Enterprise are per seat. Extensions, GitOps views, cloud cluster integrations and the security center are paid. The desktop app is not open source, so check the terms before a company rollout.
Alternatives. kubectl is the scriptable baseline, and K9s is fastest over SSH. Headlamp, now part of Kubernetes SIG UI and Apache 2.0, is the open-source GUI: desktop or in-cluster, with plugins. Docs: lenshq.io.
7. Prometheus: Kubernetes monitoring
What and why. Prometheus (CNCF graduated) is the standard for Kubernetes metrics: labelled numeric time series queried with PromQL.
How it works. Prometheus pulls /metrics from each target every scrape_interval. kubernetes_sd_configs asks the API server for nodes, pods, Services or EndpointSlices, and relabeling picks targets and labels. Samples go to a local TSDB on a volume. Recording rules precompute queries, alerting rules fire when an expression holds, and Alertmanager groups, silences and routes alerts. Grafana draws dashboards.
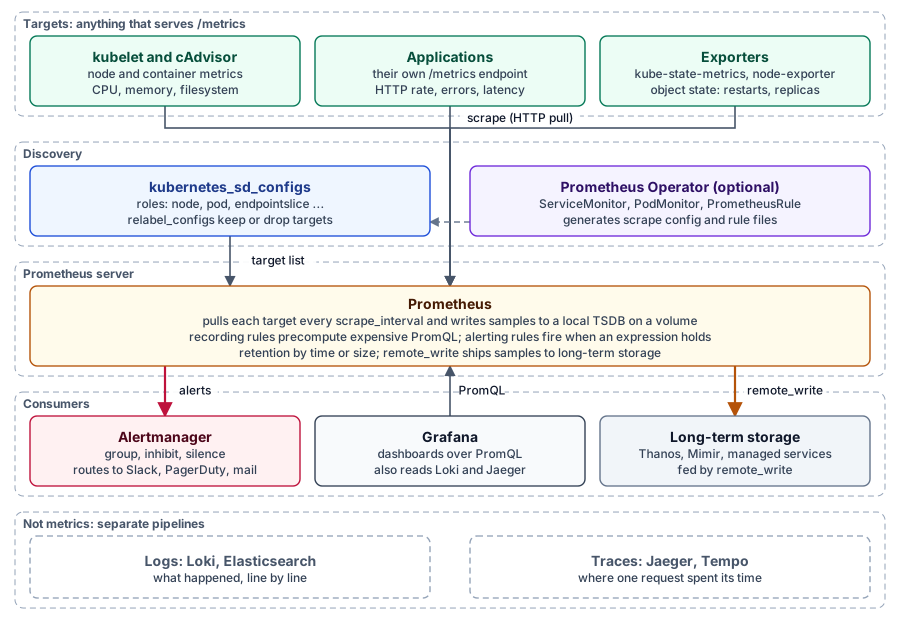
A plain scrape job that keeps pods annotated prometheus.io/scrape: "true":
scrape_configs:
  - job_name: kubernetes-pods
    kubernetes_sd_configs:
      - role: pod
    relabel_configs:
      - source_labels: [__meta_kubernetes_pod_annotation_prometheus_io_scrape]
        regex: "true"
        action: keep
      - source_labels: [__meta_kubernetes_pod_annotation_prometheus_io_path]
        regex: (.+)
        target_label: __metrics_path__
      - source_labels: [__meta_kubernetes_namespace]
        target_label: namespace
      - source_labels: [__meta_kubernetes_pod_name]
        target_label: pod
Most clusters use the kube-prometheus-stack chart instead: Prometheus Operator, Alertmanager, Grafana, node-exporter and kube-state-metrics, with targets and rules as CRDs. By default its Prometheus selects only objects labelled with the Helm release name, hence release: monitoring.
apiVersion: monitoring.coreos.com/v1
kind: ServiceMonitor
metadata:
  name: shop-web
  namespace: shop
  labels:
    release: monitoring
spec:
  selector:
    matchLabels:
      app.kubernetes.io/name: shop-web
  endpoints:
    - port: http-metrics
      path: /metrics
interval: 30sapiVersion: monitoring.coreos.com/v1
kind: PrometheusRule
metadata:
name: shop-web
namespace: shop
labels:
release: monitoring
spec:
groups:
- name: shop-web
rules:
- record: job:http_server_requests:rate5m
expr: sum by (job) (rate(http_server_requests_total[5m]))
- alert: ShopWebHighErrorRatio
expr: |
sum(rate(http_server_requests_total{job="shop-web", status="5xx"}[5m]))
/ sum(rate(http_server_requests_total{job="shop-web"}[5m])) > 0.05
for: 10m
labels:
severity: critical
annotations:
summary: "More than 5% of shop-web requests fail"
- alert: ContainerRestarting
expr: increase(kube_pod_container_status_restarts_total{namespace="shop"}[15m]) > 2
labels:
severity: warning
annotations:
summary: "{{ $labels.pod }}/{{ $labels.container }} restarted {{ $value | humanize }} times in 15 min"PromQL I ran against my lab Prometheus:
# CPU cores used per namespace (cAdvisor)
sum by (namespace) (rate(container_cpu_usage_seconds_total{container!="", image!=""}[5m]))

# Working-set memory per namespace, the figure kubectl top and kubelet eviction use
sum by (namespace) (container_memory_working_set_bytes{container!="", image!=""})

# Containers above 90% of their memory limit
max by (namespace, pod, container) (container_memory_working_set_bytes{container!=""})
  / max by (namespace, pod, container) (container_spec_memory_limit_bytes{container!=""} > 0) > 0.9

# Containers that restarted in the last hour (needs kube-state-metrics)
sum by (namespace, pod) (increase(kube_pod_container_status_restarts_total[1h])) > 0

# 5xx ratio for one job; "or vector(0)" shows 0 instead of an empty panel when there are no errors
(sum(rate(http_server_requests_total{job="jithendar-com", status="5xx"}[5m])) or vector(0))
  / sum(rate(http_server_requests_total{job="jithendar-com"}[5m]))
Two lessons. My site labels status as a class (status="5xx"), so the usual status=~"5.." matches nothing: read your labels first. And the restart query returned nothing, because my lab has no kube-state-metrics.
Storage and cardinality. Set retention by time or size. Every label combination is a series, so never label by user ID or raw URL. For long history or many clusters, remote_write to Thanos, Mimir or a managed service.
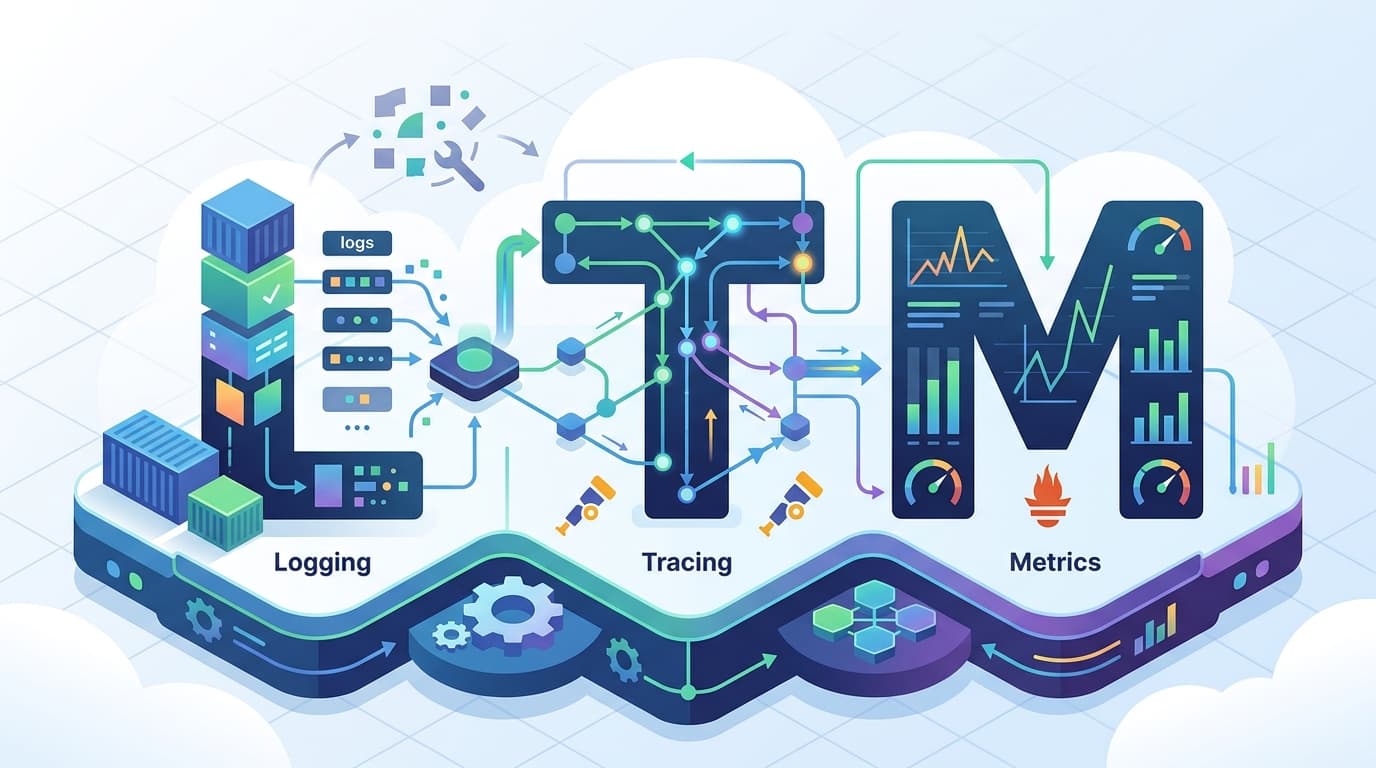
Metrics are not logs or traces. Metrics say how much and how often. Logs (Loki) say what happened, and traces (Jaeger, Tempo) say where one request spent its time. My observability write-up shows all three. Docs: prometheus.io/docs.
My Kubernetes lab: what is really there
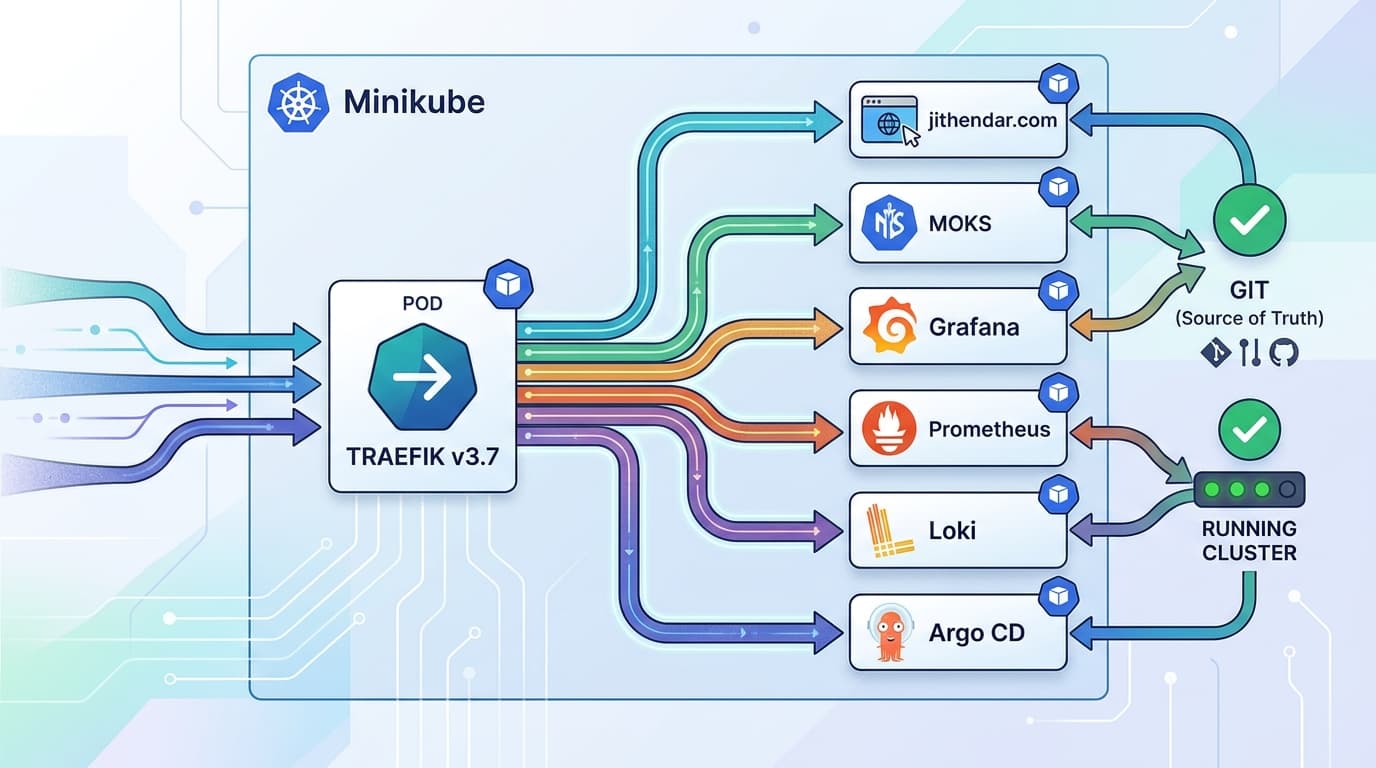
My lab cluster, mk4, runs this website, the MOKS SRE portal and RoboShop AI. I inspected it read-only on 8 November 2026.
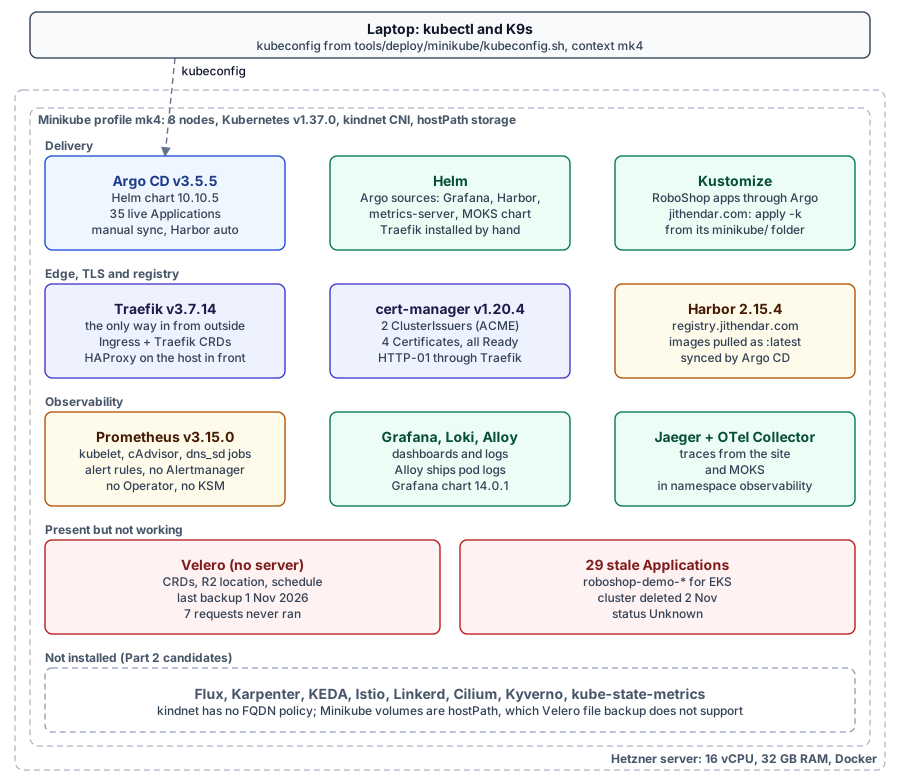
It is not a single-node cluster, as my own brief for this article assumed. It is eight Minikube nodes on one 16 vCPU, 32 GB Hetzner server. Each node reports the whole host as its capacity, so the scheduler sees 128 CPUs that do not exist, and every tool I add competes for the same memory. The 80 pods used about 1.6 cores and 16 GiB at inspection time.
| Tool | On mk4 (verified) | Worth it here? | On EKS |
|---|---|---|---|
| Helm | Argo CD and Traefik installed by hand; Grafana, Harbor and the MOKS chart rendered by Argo CD | Yes | Same |
| Argo CD | v3.5.5, 35 Applications, manual sync except Harbor | Yes | One per environment |
| Flux | Not installed | No, duplicates Argo CD | If the team prefers CLI GitOps |
| Kustomize | jithendar.com via apply -k; RoboShop through Argo CD | Yes | Same |
| K9s | From a laptop with the tools kubeconfig script | Yes | Read-only RBAC for on-call |
| Lens | Not used | Optional | Check the licence |
| Prometheus | v3.15.0; kubelet, cAdvisor and DNS jobs; no Alertmanager, Operator or kube-state-metrics | Add those two exporters | kube-prometheus-stack or managed |
What the inspection found, unfixed:
- Helm's records disagree with reality.
helm listshowsargocdaspending-installsince 27 October although it has run for 12 days, so the nexthelm upgradewill refuse with "another operation is in progress". - Two kinds of "not synced". Five MOKS apps are OutOfSync because Git moved on and sync is manual, which is expected. 29
roboshop-demo-*Applications areUnknownwiththere are no clusters with this name, because their EKS cluster was deleted on 2 November. - Stale tooling.
tools/devops-tools/k9s.shinstalls K9s v0.24.15 on CentOS 8 only; the current release is v0.51.0. - Alerts go nowhere. The config says "no Alertmanager is configured for delivery".
- A Terraform takeover is committed, not applied.
tools/minikube-infrastructure(e18e0e6) declares metrics-server, cert-manager, Istio, Kiali and the observability stack as Terraformhelm_releaseresources. Until it runs, the table above holds.
Troubleshooting scenarios
Argo CD application is OutOfSync
argocd app get shop-web                      # sync, health and the last operation's error
argocd app diff shop-web                     # exactly which fields differ
kubectl -n argocd get application shop-web -o jsonpath='{.status.conditions}'
kubectl -n argocd logs deploy/argocd-repo-server --since=15m | grep -i error
If only your new commit differs, sync it. If a field flips back after every sync, a controller owns it (an HPA, a mutating webhook, a defaulted value): add ignoreDifferences. A ComparisonError means Argo CD cannot render or reach something, such as a bad Helm value, a missing CRD, Git credentials or a deleted cluster. Avoid --force and --prune until you know what they would replace or delete.
Prometheus stops scraping application metrics
kubectl -n monitoring port-forward svc/prometheus-operated 9090   # then open /targets
kubectl -n shop get servicemonitor shop-web --show-labels         # release=monitoring present?
kubectl -n shop get endpointslices -l kubernetes.io/service-name=shop-web
kubectl -n shop run curl --rm -it --image=curlimages/curl --restart=Never -- \
  curl -s http://shop-web:9464/metrics | head
A missing target is a discovery problem: labels, or a port name mismatch. A DOWN target is an endpoint problem: path, NetworkPolicy or TLS. UP with an empty panel is a query problem: label names, or an empty numerator.
Helm upgrade blocked by a stuck release
helm history argocd -n argocd    # last revision: pending-install, pending-upgrade or failed
helm status argocd -n argocd
For pending-upgrade, helm rollback to the last deployed revision clears the lock. A pending-install release has nothing to roll back to: test on a copy before uninstalling anything that holds state.
Interview questions
Helm or Kustomize?
Helm packages and versions applications with templates and values and can roll back. Kustomize patches plain YAML per environment with no templates or release state. Helm for consuming and publishing packages, Kustomize for your own environment differences; many teams use both.
Argo CD or Flux?
Both are CNCF graduated pull-based GitOps controllers. Argo CD centres on an Application CRD and a web UI with SSO and projects. Flux is composable controllers driven by CRDs and the CLI, with real Helm releases. Pick one per workload so they never fight.
How does Prometheus discover Kubernetes targets?
Through kubernetes_sd_configs: it watches the API server for nodes, pods, Services, EndpointSlices or Ingresses, and relabeling keeps, drops and renames the results. With the Operator, ServiceMonitor and PodMonitor objects generate that configuration.
Where to start: the beginner path
kubectl → Helm → Kustomize → K9s → Prometheus.
- Prerequisites: containers, YAML, basic Linux networking.
- Exercises: deploy an app with plain YAML; install kube-prometheus-stack with Helm and change a value; turn your YAML into a base with dev and prod overlays; debug a crashing pod with only K9s; write a ServiceMonitor and an alert, break the app and watch it fire.
- Outcome: you can ship, change and observe an application and explain each step.
Intermediate and advanced paths, the production architecture and recommendations for labs, startups and enterprise EKS are in Part 2. See also Traefik on Minikube for the lab's ingress and the DevOps interview preparation guide.
Discussion comments
No comments yet. Start the discussion.