Why I use Traefik
My mk4 cluster is a five-node Minikube profile running on one Hetzner server. It hosts this website, the MOKS SRE portal, Grafana, Prometheus, Loki and Argo CD. Each application listens on a private pod address inside a Docker network that the internet cannot reach. Giving every application its own public port would mean many firewall rules, many certificates and many ways to get something wrong.
A shared ingress layer solves that. One process accepts all HTTP and HTTPS traffic on ports 80 and 443, terminates TLS with one certificate and decides from the hostname and path which application gets the request. Common policies such as HTTPS redirects, basic authentication, IP allowlists and compression live in one place instead of in every application.
On mk4 that process is Traefik. This article explains how Traefik works, then walks through my real setup: how it is installed, how traffic reaches it, which applications use it, and where the gaps are. Every implementation claim comes from the tools, jithendar.com and moks repositories, or from a read-only inspection of the running cluster on 5 November 2026. Recommendations are marked as such.
What Traefik is and how it works
Traefik is a reverse proxy: clients connect to it, and it opens a separate connection to the real application. Inside Kubernetes it acts as an ingress controller, turning routing objects into live proxy configuration. Because it spreads requests across every ready pod behind a route, it is also a load balancer.
Six concepts cover most of what Traefik does:
- EntryPoints are the ports Traefik listens on. My install has
web(HTTP, container port 8000) andwebsecure(HTTPS, 8443), plus internaltraefik(8080) andmetrics(9100) ports that are not exposed. - Routers match a request by host, path, method or header, then pick middlewares and a service.
- Services in Traefik's model are load balancers over a list of servers. A Traefik service is not a Kubernetes Service. Traefik reads the Kubernetes Service's EndpointSlices and sends traffic straight to the pod addresses. Its RBAC role grants
listandwatchonendpointslicesfor this reason. - Middlewares change requests or responses on the way through: redirects, authentication, headers, compression or prefix stripping.
- Providers are where configuration comes from. The Kubernetes providers watch the API server and rebuild routers when objects change.
- Static configuration (entryPoints, providers, logging) is fixed when Traefik starts. Dynamic configuration (routers, services, middlewares, TLS) changes while it runs.
Traefik can read three kinds of Kubernetes routing objects. A standard Kubernetes Ingress is portable but limited, so Traefik extends it with traefik.ingress.kubernetes.io/* annotations. IngressRoute and the other traefik.io CRDs expose Traefik's full rule language, such as method matching and TCP routing by TLS server name. The Gateway API is the newer Kubernetes standard. Traefik v3.7 supports it through a separate provider that requires the Gateway API CRDs to be installed (docs).
My cluster runs the Ingress provider and the CRD provider. Most routes are standard Ingress objects with Traefik annotations. CRDs are used where Ingress cannot express the rule. The Gateway API provider is not enabled, and no Gateway API CRDs are installed.
My Minikube traffic architecture
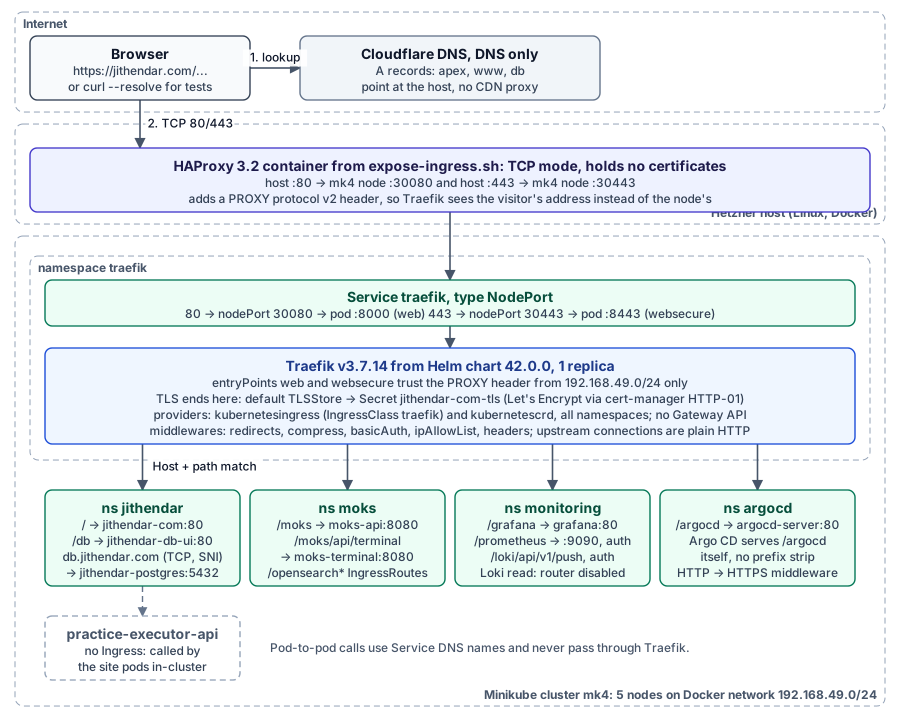
Here is the verified path of a request to https://jithendar.com/grafana/:
- DNS. The domain uses Cloudflare name servers, but the
jithendar.com,wwwanddbA records are DNS only. They resolve to the Hetzner host itself, so Cloudflare does not proxy traffic, cache it or terminate TLS. - Host. Docker-driver Minikube nodes live on a private Docker network (
192.168.49.0/24).deploy/minikube/expose-ingress.shin thetoolsrepository runs anhaproxy:3.2-alpinecontainer on that network. It publishes host ports 80 and 443 and forwards raw TCP to the node's NodePorts 30080 and 30443. HAProxy holds no certificates. - PROXY protocol. NodePort traffic is source-NATed by kube-proxy, so without help every visitor would appear as a node address. HAProxy prepends a PROXY protocol v2 header with the visitor's real address. Traefik trusts that header only from
192.168.49.0/24. - Traefik. The
traefikNodePort Service hands the connection to the single Traefik pod. TLS terminates here. Thewebsecurerouter matchesHost(jithendar.com)with path prefix/grafanaand forwards to thegrafanaService in namespacemonitoring. - Backend. The upstream connection is plain HTTP inside the cluster. No ServersTransport or backend TLS is configured.
Routing uses one hostname and many paths. Traefik ranks rules by length, so /moks/api/terminal beats /moks, and /moks beats the site's catch-all /. A path that matches no specific route falls through to the website, which is why a broken route often shows the site's 404 page rather than an error from Traefik.
An Ingress backend must be a Service in the Ingress's own namespace; that is a Kubernetes rule. Middleware references take the form <namespace>-<name>@kubernetescrd, and every reference on mk4 stays inside its own namespace. Cross-namespace references from IngressRoutes are off by default (allowCrossNamespace: false) and are not enabled here.
Deploying Traefik does not put all cluster traffic behind it. Only objects with a matching route are reachable from outside. Pod-to-pod calls use Service DNS names and never touch Traefik. The site calls practice-executor-api that way, and Grafana reads Prometheus at prometheus.monitoring.svc.cluster.local.
How Traefik is installed and configured
Traefik is not managed by Argo CD. The mk-platform AppProject in tools says so directly: "Argo CD and Traefik controllers remain externally managed". It is a Helm release installed by a person:
| Item | Value | Evidence |
|---|---|---|
| Chart | traefik 42.0.0 from https://traefik.github.io/charts | scripts/argocd/bootstrap.py, helm history |
| Application version | Traefik v3.7.14 | live image docker.io/traefik:v3.7.14 |
| Namespace / release | traefik / traefik | live |
| Values | deploy/minikube/traefik/values.yaml | tools repository |
| Replicas | 1 | values, live |
| Resources | requests 100m / 128Mi, limits 500m / 256Mi | values, live |
| Persistence | none: certificates come from Kubernetes Secrets | values |
Chart and application versions move independently. Chart 42.0.0 ships Traefik v3.7.14, so helm list and the container image report different numbers.
The values file is short. The comments below are mine; the YAML is the real file, trimmed:
ingressClass:
  enabled: true
  name: traefik
  isDefaultClass: false        # Ingresses must ask for traefik explicitly
providers:
  kubernetesIngress:
    ingressClass: traefik
    publishedService:
      enabled: false           # a NodePort has no load-balancer address to copy
    ingressEndpoint:
      hostname: jithendar.com  # written to Ingress status so Argo CD reports Healthy
service:
  spec:
    type: NodePort
ports:
  web:
    nodePort: 30080
    proxyProtocol:
      trustedIPs: ["192.168.49.0/24"]   # only the Minikube Docker network
  websecure:
    nodePort: 30443
    proxyProtocol:
      trustedIPs: ["192.168.49.0/24"]
ingressRoute:
  dashboard:
    enabled: false             # no public dashboard route
The running pod's arguments confirm the result. Both kubernetescrd and kubernetesingress are enabled, with no namespace or label restrictions, and ingressClass=traefik. websecure.http.tls=true is set, Prometheus metrics are served on the metrics entryPoint, and api.dashboard=true is set. The chart also installs the CRDs and a ClusterRole that can read Services, EndpointSlices, Secrets, Ingresses and every traefik.io kind, cluster-wide.
Bootstrap order matters. ./bootstrap-cluster.sh --context mk4 runs bootstrap.py, which installs cert-manager, then Traefik, then Argo CD and Argo CD's own Ingress (kubectl apply -k deploy/minikube/argocd). It reuses an existing release and never upgrades it, so a values change goes through the dedicated wrapper:
# From the tools repository. Runs helm upgrade --install with the pinned chart and values.
KUBE_CONTEXT=mk4 ./deploy-traefik.sh
# On the Hetzner host only, after Traefik accepts the PROXY header:
bash deploy/minikube/expose-ingress.sh
Prerequisites are helm and kubectl on the client, and Docker on the host for the second step. The PROXY protocol rollout is ordered on purpose. Traefik must accept the header before HAProxy starts sending it, or every connection fails. expose-ingress.sh checks the Deployment's arguments and refuses to run otherwise.
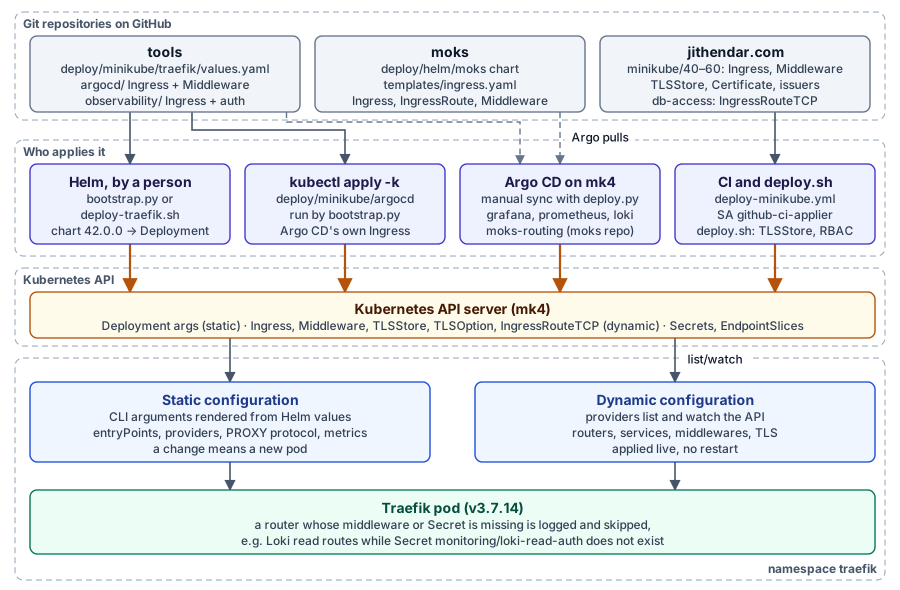
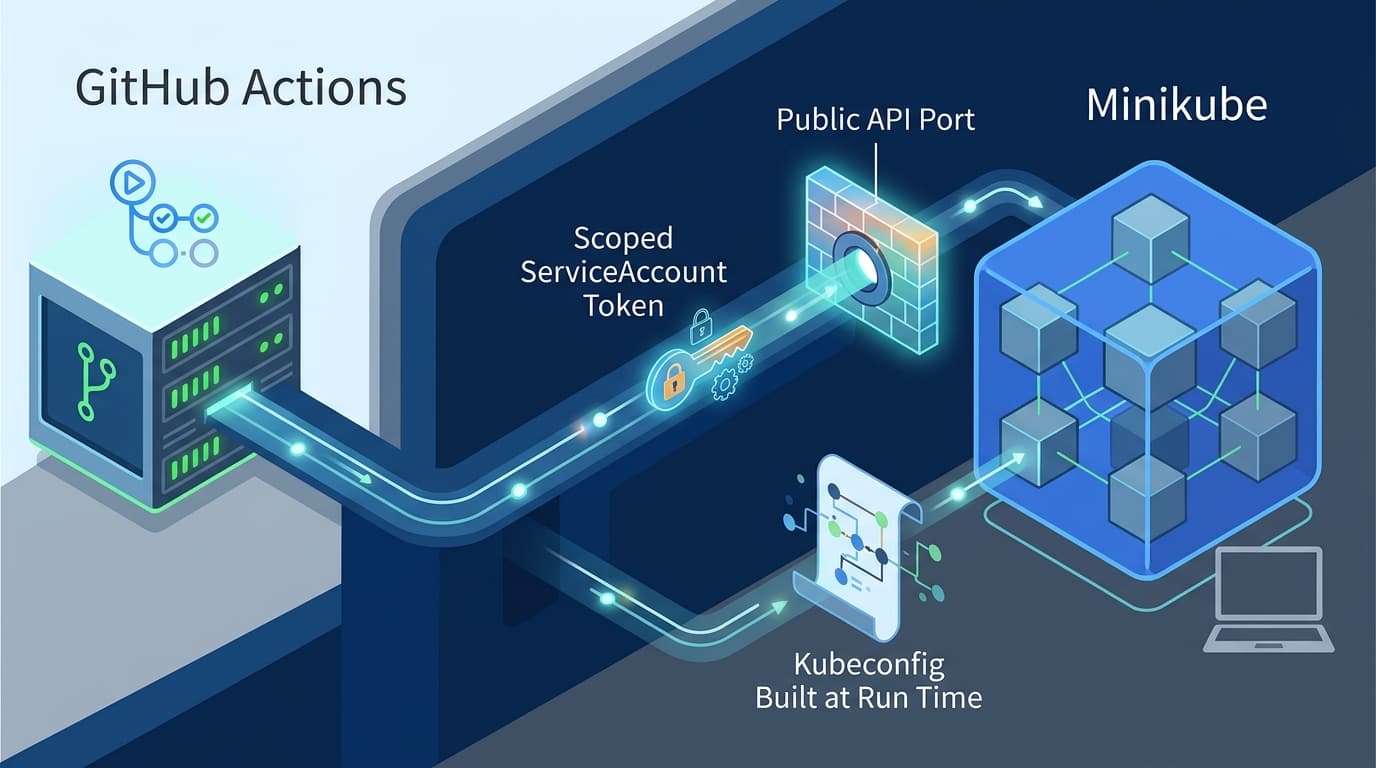
Routes reach Traefik through several workflows, shown above. Argo CD (manual sync, no automated policy) owns the Grafana, Prometheus, Loki and MOKS routes. The website's routes, TLSStore and certificates come from ./deploy.sh and a GitHub Actions workflow whose ServiceAccount may create Ingresses and Traefik Middlewares only in namespace jithendar. Traefik picks up all of these changes without a restart.
How applications are enabled through Traefik
Every application on mk4 is onboarded the same way:
- Deploy the application and a ClusterIP Service. Check that the selector matches the pod labels and that
targetPortis the container port. - Confirm ready endpoints:
kubectl --context mk4 get endpointslices -n <ns> -l kubernetes.io/service-name=<svc>. Traefik routes only to ready endpoints. - Write the route. Use an Ingress with
ingressClassName: traefik. Use an IngressRoute only when you need methods, regexes or TCP. - Choose host and path. Use a path on
jithendar.comunless the application cannot live under a subpath. - Attach middlewares with
router.middlewares, in the same namespace. - TLS. Set
router.tls: "true"and omitsecretName. The default TLSStore in namespacejithendarthen serves the Let's Encrypt certificate forjithendar.comandwww.jithendar.com. A new hostname needs its own cert-manager Certificate. - DNS changes only for a new hostname, as a DNS-only record.
- Commit and reconcile through the workflow that owns the namespace.
- Validate with
curl(see the final section).
Three verified examples show the variations.
The website (namespace jithendar) uses four Ingresses. jithendar-com serves / on websecure with strip-trace-headers and compress. jithendar-com-http sends HTTP to a permanent HTTPS redirect. Two www Ingresses redirect to the apex. Live, http://jithendar.com/ returns 301 and https://www.jithendar.com/x returns 301 to https://jithendar.com/x. The trace-header middleware removes traceparent, tracestate and baggage sent by clients, so a visitor cannot choose the site's trace IDs.
MOKS (namespace moks) uses a Helm template in its own repository. /moks/api/terminal goes to moks-terminal, and everything else under /moks goes to moks-api. Traefik passes the WebSocket upgrade through without special settings. The template deliberately leaves out compression because it can buffer server-sent events. It also adds an IngressRoute for /opensearch that only admits GET, HEAD and search POSTs, behind basic auth and stripPrefix. A plain Ingress cannot express method rules.
Argo CD and Grafana show the subpath trade-off. Neither strips its prefix. Argo CD runs with server.rootpath: /argocd and server.basehref: /argocd. Grafana sets root_url: https://jithendar.com/grafana/ and serve_from_sub_path: true. Stripping a prefix at Traefik is easy, but the application still generates links, redirects, cookies and asset URLs from its own idea of the base path. If the two disagree, the HTML loads and the CSS and JavaScript return 404. Adminer at /db/ goes further: its files are copied into a db/ folder, so session cookies stay scoped to /db/.
Application inventory
| Application | Namespace | Host/path | Routing resource | Backend Service/port | TLS/authentication | Evidence |
|---|---|---|---|---|---|---|
| Website | jithendar | jithendar.com/, www | 4 × Ingress | jithendar-com:80 → 3000 | default cert; app login | Git + live; 200/301 |
| Adminer | jithendar | /db | Ingress | jithendar-db-ui:80 | ipAllowList, no-index headers | Git + live; 200 from allowlisted address |
| PostgreSQL | jithendar | db.jithendar.com:443 (SNI) | IngressRouteTCP | jithendar-postgres:5432 | own cert, ALPN postgresql, TCP allowlist | Git + live object; not connected |
| MOKS | moks | /moks, /moks/api/terminal | Ingress (Helm) | moks-api:8080, moks-terminal:8080 | default cert; app login | Git + live; 308/200 |
| OpenSearch, Dashboards | moks | /opensearch, /opensearch-dashboards | 2 × IngressRoute | moks-opensearch, moks-opensearch-dashboards | basic auth | live; 401 |
| Grafana | monitoring | /grafana | Ingress (chart values) | grafana:80 | default cert; Grafana login | Git + live; 302 to login |
| Prometheus | monitoring | /prometheus, /prometheus/api/v1/write | 2 × Ingress | prometheus:9090 | basic auth (separate write login) | Git + live; 401 |
| Loki push | monitoring | /loki/api/v1/push | Ingress | loki:3100 | basic auth | Git + live object |
| Loki read | monitoring | 4 read paths | Ingress | loki:3100 | basic auth; Secret missing, router skipped | Traefik log; 404 |
| Argo CD | argocd | /argocd | 2 × Ingress | argocd-server:80 | default cert; Argo CD login | Git + live; 200 |
No Traefik route: the practice executor and dispatcher, Redis, Jaeger (port-forward only), the OpenTelemetry Collector, Velero, and the roboshop-ai namespace (/roboshop returns 404). JFrog and Vault have Ingress files in tools/deploy/minikube, but their namespaces do not exist, so they are declared only.
Traefik benefits and features
Actively configured on mk4:
- Kubernetes discovery. A new Ingress becomes a live router within seconds, with no reload.
- Host and path routing, including
Exactpaths for the Loki and Prometheus write endpoints, so that only those URLs are public. - TLS termination with a default TLSStore and cert-manager certificates issued through HTTP-01 challenges on the
webentryPoint. - TCP routing by SNI for PostgreSQL on port 443, with its own TLSOption.
- Middlewares:
redirectScheme,redirectRegex,compress(zstd, br, gzip),basicAuthwithremoveHeader,ipAllowList,headers,stripPrefix. - WebSockets for the MOKS web terminal, passed through without extra configuration.
- Load balancing across the two website pods, using their EndpointSlices.
- PROXY protocol to recover client addresses.
Supported in v3.7 but not enabled here: access logs, which are off unless accesslog is set (docs); OpenTelemetry tracing; the rateLimit, forwardAuth and retry middlewares; weighted routing and mirroring through TraefikService; and the Gateway API provider. Prometheus metrics are exposed on port 9100, but nothing scrapes them (see below). The dashboard API is on but has no route, so it is reachable only through a port-forward.
Needs another product or component: the chart installed hub.traefik.io CRDs (API management, AI gateway). These belong to Traefik Hub, a separate commercial product. Nothing on mk4 uses them. A WAF, a service mesh and single sign-on are not provided by Traefik Proxy on its own. Single sign-on would need an identity provider behind forwardAuth.
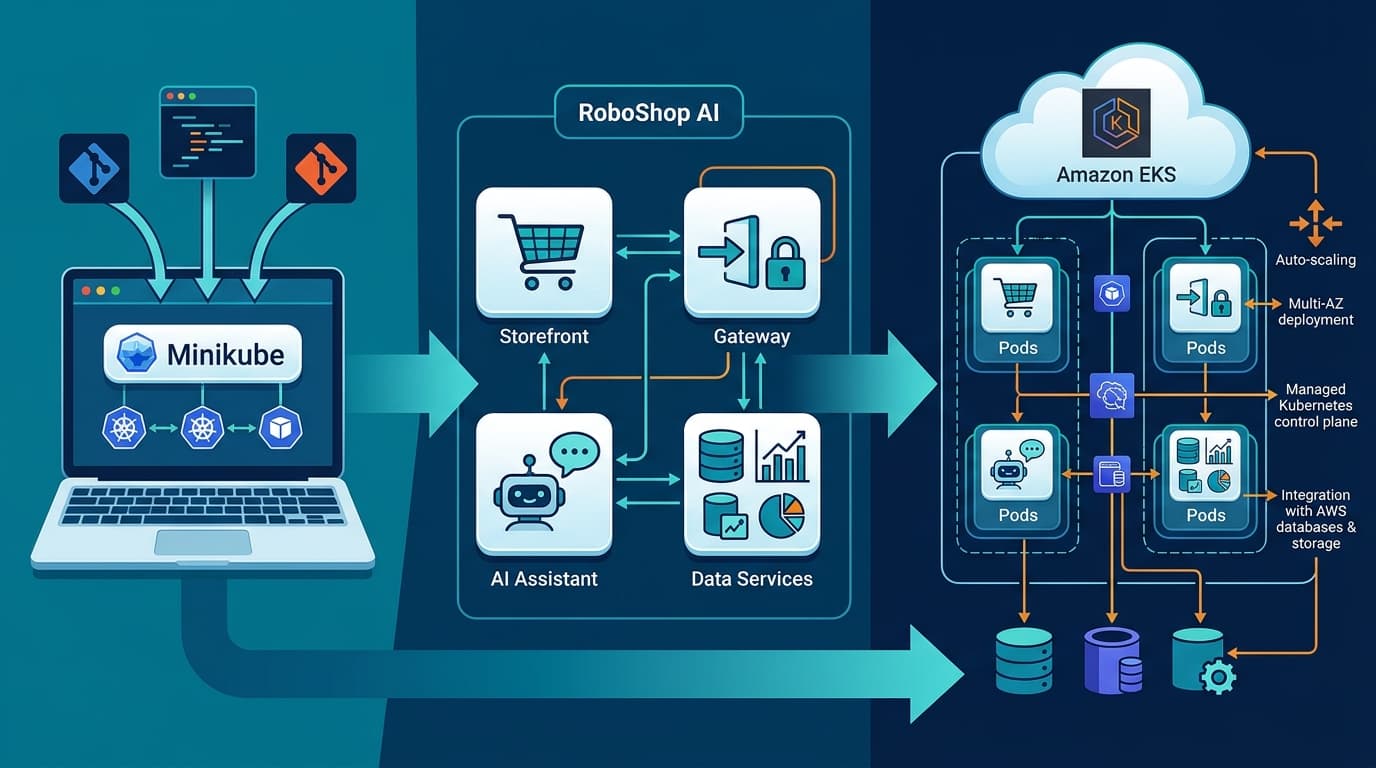
Trade-offs. The useful rules live in Traefik-specific annotations and CRDs, so moving to another controller means rewriting them. The EKS experiment used Istio for this reason, and none of these objects carried over. Routing is spread across three repositories and four apply paths, so it takes some work to answer "who owns this route". The ingress also runs on one pod, behind one HAProxy container, on one server. A pod restart, a host reboot or a Docker network change takes every application offline at once. That is acceptable for a personal platform, but it is not high availability, and the setup is not production-ready just because it works.
Security and observability
What is in place:
- Dashboard and API are not routed (
ingressRoute.dashboard.enabled: false). ThetraefikentryPoint is not part of the Service. - Authentication boundaries. Prometheus, Loki and OpenSearch have no login of their own, so Traefik
basicAuthguards them. Each remote writer gets its own Secret, so a push credential cannot read data. Grafana, Argo CD, MOKS and the website use their own logins. Traefik only carries the traffic. - TLS. cert-manager renews the Let's Encrypt certificate (valid until 25 January 2027 when checked). An unknown SNI still receives the
jithendar.comcertificate from the default store. - Forwarded headers.
forwardedHeaders.trustedIPsis unset, so Traefik ignores client-suppliedX-Forwarded-*headers and builds them from the PROXY-protocol address. Any process that can reach a NodePort from inside192.168.49.0/24could forge that header, so the IP allowlist is one layer, not the only one. - Network policies. Application namespaces such as
jithendarandmoksadmit traffic from namespacetraefik. There is no NetworkPolicy intraefikitself. - Secrets stay in the cluster. Basic-auth and TLS Secrets are created outside Git.
Gaps and recommendations:
- The ClusterRole can read every Secret in every namespace, which is the chart default. Setting
providers.*.namespacesto the application namespaces would narrow what Traefik watches. Separate Roles would be needed to narrow the RBAC itself. - Access logs are off, so there is no request trail at the edge. If enabled, keep the default
headers.defaultMode: dropso thatAuthorizationheaders are never logged. - Metrics are exposed, and the pod carries
prometheus.io/scrapeannotations, but the Prometheus config intoolsuses explicit jobs and has none for Traefik. Adding a job would give request rates and latency per router. - Traefik's own logs reach Loki through Alloy, because Alloy collects every namespace.
An ingress controller is not a WAF, a service mesh or full API management. It does not stop application-level attacks, encrypt pod-to-pod traffic or replace authentication inside the application.
Validation, troubleshooting, and conclusion
These read-only checks, run against --context mk4, cover each layer:
kubectl --context mk4 -n traefik get pods,svc           # pod Ready; NodePorts 30080/30443
kubectl --context mk4 get ingressclass                  # "traefik" exists, controller traefik.io/ingress-controller
kubectl --context mk4 get ingress -A                    # every route, its class and hosts
kubectl --context mk4 get ingressroute,ingressroutetcp,middleware,tlsstore -A
kubectl --context mk4 -n jithendar get endpointslices   # backends have ready endpoints
kubectl --context mk4 -n monitoring describe ingress loki-read
kubectl --context mk4 -n traefik logs deployment/traefik --tail=100 | grep -i err
curl -I https://jithendar.com/grafana/login
The pod check shows that the controller is running. The IngressClass check shows that Ingresses naming traefik have an owner. EndpointSlices show whether a 503 is likely. The logs are the only place Traefik explains a rejected route. On mk4 they currently show secret 'monitoring/loki-read-auth' not found, and the four Loki read routers are skipped as a result. Those requests fall through to the website's / rule and return its 404 page.
To test a route before DNS points at the server, keep the real hostname so that SNI, the Host header and the certificate check all behave as they will in production:
curl -sv --resolve jithendar.com:443:<HOST_IP> https://jithendar.com/moks/ -o /dev/nullcurl -H 'Host: …' https://<HOST_IP>/ is not equivalent, because the TLS server name would be the IP address.
| Symptom | Likely causes | Checks | Resolution |
|---|---|---|---|
| Site's 404 page on an app path | no matching router; wrong host or path; router skipped | get ingress -A; Traefik logs | fix host or path; create the missing Secret or Middleware |
| Traefik's plain 404 | no router for that host at all | curl --resolve with the exact host | add a rule for the hostname |
| 502 | pod refuses the connection; wrong targetPort; scheme mismatch | describe svc; kubectl port-forward to the pod | correct the port; match HTTP or HTTPS |
| 503 | no ready endpoints (allowEmptyServices is on) | get endpointslices | fix readiness or the Service selector |
| Certificate warning | host not in the certificate; cert not Ready | get certificate -A; openssl s_client -servername | add the name to a Certificate |
| Redirect loop | an external proxy terminating TLS and sending HTTP | curl -IL | not applicable while DNS-only; if proxying is enabled, use Full (strict) |
| Middleware ignored | wrong <ns>-<name>@kubernetescrd; CRD missing | Traefik logs | correct the reference |
| Ingress ignored | ingressClassName missing or different | get ingress -A CLASS column | set traefik (it is not the default class) |
| CSS and JS 404 under a subpath | prefix stripped while the app assumes / | browser network tab | set the app's base path, or use a subdomain |
| WebSocket drops | compression or buffering middleware; idle timeouts | curl with Upgrade headers | remove buffering middlewares from the route |
| Route never appears | CRD provider namespace or label filter | pod arguments | none set here; check after changing values |
What the setup achieves: one Helm-managed Traefik v3.7.14 pod serves the website, MOKS, Grafana, Prometheus, Loki push, Argo CD and two database endpoints under one domain, mostly with one shared certificate. Client addresses are preserved, admin APIs sit behind authentication, and most routing is reconciled from Git.
Current limitations: single pod, single host, no edge access logs or scraped metrics, broad Secret access, and routing ownership split across several workflows.
Implementation gaps found during inspection
- Secret
monitoring/loki-read-authis missing, so the Loki read routes are disabled. Traefik logs the error repeatedly. - Helm revision 2 (the PROXY protocol upgrade on 4 November) is marked
failed("context canceled"), but the Deployment runs its arguments.bootstrap.pyrefuses a release that is notdeployed, so rerundeploy-traefik.shto settle the state. - Grafana, Prometheus and Loki Ingresses set no
router.entrypoints, so their routers attach to every default entryPoint, including the internalmetricsone (visible in the logs). Setwebsecureexplicitly. - Traefik metrics are not scraped, and access logs and tracing are off.
- There is no NetworkPolicy or PodDisruptionBudget in
traefik, and only one replica runs. - The Traefik README says "Vultr", but the server is at Hetzner. It also points at
docs/operations/scripts.md, which does not exist. - JFrog and Vault Ingresses are declared in Git but not deployed.
- Unused Traefik Hub CRDs are installed by the chart.

Discussion comments
No comments yet. Start the discussion.