jithendar.com is a Next.js site that I run myself on mk4, a four-node minikube cluster on one server. It has articles, an admin area, accounts, comments, an AI image generator for cover images and a Python practice area that runs visitors' code in a separate sandbox service. When something breaks, I want to answer three questions quickly: what failed, where did the time go, and is it still happening.
This article explains how the site answers them today: structured logs in Loki, traces in Jaeger, metrics in Prometheus, all shown in Grafana. It is based on the code in the jithendar.com and tools repositories and on what I could see on the live cluster on 4 November 2026. That day's review found real gaps, and section 10 lists them with their fixes.
1. The application and what it needs from observability
The parts that matter here:
- Two Next.js 16 pods (namespace
jithendar) serve every page, API route and server action. Next.js runs aproxy.tsstep before each request (redirects, a maintenance page, a request id). - PostgreSQL and Redis in the same namespace.
- Outside services: Cloudflare R2 for media, Google's Gemini API for cover images, Cloudflare Turnstile, IndexNow, email providers.
- practice-executor, a small FastAPI service that queues and runs Python practice jobs in sandbox pods.
- Traefik as the ingress, in front of everything.
The requirements are modest but strict:
- A visitor who sees an error gets a short reference, and that reference finds the logs and the trace.
- Request rate, error rate and latency per route pattern (
/blog/[slug]), never per URL. - No passwords, tokens, cookies, email addresses or free text in the log store or the trace store.
- If any of the monitoring stack is down, the site keeps serving pages.
2. Logs, metrics and traces in plain words
- A log line is one event, written by the code when something happens: "comment submitted", "request completed in 412 ms with status 200". Logs are good for what exactly happened.
- A metric is a number counted over time: requests per second, the share that failed, how long the slowest 5 % took. Metrics are cheap to keep and good for is something wrong right now.
- A trace is the story of one request, broken into spans: "render the page" took 300 ms, inside it "read the image from R2" took 120 ms. Traces are good for where did the time go.
The three are most useful when they share an id. On this site that id is the trace id, a 32-character hex string that appears on every log line, every span and every error message a visitor sees.
3. The tools, and why these ones
Nothing here was installed just for the site. The cluster already ran a monitoring stack for other projects, configured in the tools repository, and the site plugs into it:
| Signal | Tool | Where it runs | Why it fits |
|---|---|---|---|
| Traces | @vercel/otel in the app, OpenTelemetry Collector 0.162, Jaeger 2.22 | app pods, namespace observability | @vercel/otel is the OpenTelemetry setup the Next.js docs describe, and Next.js already creates spans for routing and rendering |
| Logs | JSON on stdout, Grafana Alloy, Loki | namespace monitoring | no logging library in the app; Alloy reads pod logs through the Kubernetes API, so no agent per node |
| Metrics | a small Prometheus exporter in the app, Prometheus 3.15 | port 9464 in the pod, namespace monitoring | no extra dependency; request metrics come from the spans Next.js already creates |
| Dashboards | Grafana | namespace monitoring | one place for Prometheus and Loki |
There is no Alertmanager: alerts show in Prometheus, nobody is paged. Jaeger has no ingress; its UI is reached with kubectl port-forward.
4. The telemetry flow
flowchart LR
  V[Visitor] --> T[Traefik: strips trace headers]
  T --> S[jithendar-com pods]
  S -- traceparent --> E[practice-executor]
  S -- OTLP/HTTP spans --> C[OTel Collector] --> J[(Jaeger)]
  S -- JSON on stdout --> A[Alloy]
  E -- JSON on stdout --> A
  A -- logfmt lines --> L[(Loki)]
  P[(Prometheus)] -- scrapes :9464 --> S
  G[Grafana] --> P
  G --> L
  G -. trace_id link .-> J
The same flow with namespaces and the settings that matter:
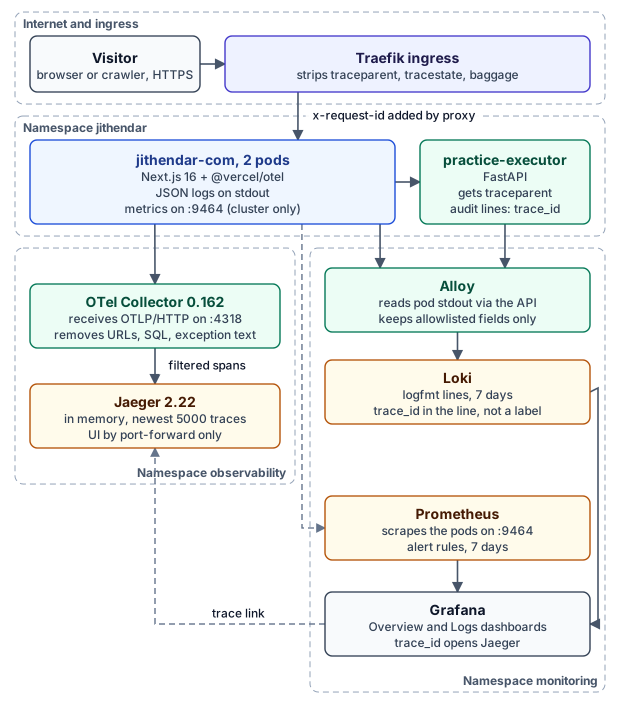
The editable source is www/docs/knowledge-sharing/jithendar-com-observability/diagrams/jithendar-com-telemetry-flow.drawio, generated by build_diagrams.py in the same folder.
5. Logs: structured, collected, stored, searched
What the app writes
Every log line is one JSON object on stdout, written by src/lib/log.ts:
const line = JSON.stringify({
  time: new Date().toISOString(),
  level,
  msg,
  event: eventOf(msg),          // "comment submitted" → "comment_submitted"
  service: "jithendar-com",
  version: process.env.GIT_SHA ?? "dev",
  ...traceFields(),             // traceId, spanId of the active span
  ...rest,
  ...(err !== undefined ? serializeError(err) : {}), // errorType, errorCode, short stack
});
Three details matter. event is a stable name derived from the message, because the collector throws msg away (more on that below). traceId comes from the active OpenTelemetry span, so any line written during a request carries the request's trace. And in production, jsonConsole() reroutes console.* from Next.js and libraries through the same function, so Next's own multi-line "⨯ Error" output becomes one JSON line instead of several lines the collector cannot parse.
Two kinds of line describe each request:
http_request, the access line, written bysrc/proxy.tsas the request arrives;http_request_completed, the completion line, written by a span processor insrc/lib/request-log.tswhen Next.js ends the request span. It has the finalstatus,durationMs, the route pattern and anoutcome:success,redirect,client_errororserver_error.
Unhandled errors from pages, layouts and route handlers go through Next's onRequestError hook in src/instrumentation.ts and become one request_failed line with the error digest.
What the collector keeps
Alloy, configured in tools/deploy/minikube/observability/loki/config.alloy, does not forward raw lines. It copies a short list of fields, each only if its value matches a strict pattern, and writes a new logfmt line:
stage.regex {
  source     = "raw_route"
  expression = `^(?P<route>/[A-Za-z0-9_./{}:\[\]-]{0,150})$`
}
stage.regex {
  source     = "raw_outcome"
  expression = `^(?P<outcome>success|failure|error|redirect|client_error|server_error)$`
}
The kept fields are event, level, route, method, status, duration_ms, dependency, operation, outcome, error_type, error_code, logger and trace_id. Messages, stack traces, IP addresses, user agents and request ids stay in the pod's own log, which kubectl logs can read until the kubelet rotates it. In Loki, a completion line looks like this:
event=http_request_completed level=info route=/blog/[slug] method=GET status=200 duration_ms=212 outcome=success trace_id=<32 hex>Labels: few and bounded
Loki indexes labels, not line content, and every new label value creates a new stream. The site's streams have only namespace, pod, container, service_name, level and Alloy's own job and instance. trace_id, routes and user data are inside the line, never labels. A test in the tools repository fails if someone turns trace_id into a label.
Searching
All of these run as-is in Grafana → Explore → Loki:
# Everything for one request (a visitor's error reference is the trace id)
{namespace="jithendar"} |= "trace_id=<trace id>"

# Errors in the last hour, by event and type
sum by (event, error_type) (count_over_time({namespace="jithendar", container="web", level="error"} | logfmt [1h]))

# Failed or slow requests
{namespace="jithendar", container="web"} | logfmt | event="http_request_completed" | status >= 500 or duration_ms > 2000
The first query also finds the practice executor's audit lines for the same request (section 6).
6. Tracing: how it starts and how context travels
Initialization
Next.js calls register() in src/instrumentation.ts once per server start, before it serves requests. That is where tracing is set up:
registerOTel({
  serviceName: process.env.OTEL_SERVICE_NAME ?? "jithendar-com",
  attributes: { "service.version": process.env.GIT_SHA ?? "dev", "deployment.environment": process.env.APP_ENV ?? process.env.NODE_ENV ?? "development" },
  traceSampler: requestSampler,
  instrumentationConfig: { fetch: fetchInstrumentationConfig() },
  spanProcessors: [outboundSpanNames, "auto", metricsSpanProcessor, requestLogSpanProcessor],
});
"auto" is the exporter @vercel/otel builds from OTEL_EXPORTER_OTLP_ENDPOINT (set to the collector's OTLP/HTTP port in the Deployment). Spans are batched and sent in the background, so a slow or missing collector does not hold up a response. The two other processors turn finished request spans into the completion log line and the Prometheus request metrics, so all three signals describe the same requests.
Next.js creates the request, routing and rendering spans itself. @vercel/otel adds spans for outgoing fetch and node:http calls. The site adds its own in src/lib/trace.ts: one per AWS SDK call (r2.PutObject, ses.SendEmail, …), mail.send, job <kind> for queued jobs, backup.run and startup.migrate.
Which requests are traced
Every request, except health probes, by requestSampler in src/lib/tracing-config.ts:
shouldSample(context, _traceId, _name, _kind, attributes) {
  if (isHealthProbe(attributes["http.target"])) return { decision: NOT_RECORD };
  const parent = trace.getSpanContext(context);
  if (parent && !parent.isRemote) return { decision: parent.traceFlags & TraceFlags.SAMPLED ? RECORD_AND_SAMPLED : NOT_RECORD };
  return { decision: RECORD_AND_SAMPLED };
}
The isRemote check is deliberate. Next.js continues any W3C traceparent header it receives. Without the check, a request carrying traceparent: 00-…-00 (the "not sampled" flag) would switch off its own trace, and with it the completion line and the request metric, because both come from the span. A Traefik middleware also removes traceparent, tracestate and baggage from internet requests (k8s/40-middlewares.yaml), so visitors cannot pick the trace id that becomes their error reference either.
Across the one internal service boundary
The site calls practice-executor over HTTP. @vercel/otel sends traceparent only to URLs listed in propagateContextUrls, and the site lists exactly one:
propagateContextUrls: executor ? [`${executor}/`] : [],Third parties (Gemini, R2, Turnstile) never receive the trace context. The executor has no OpenTelemetry SDK. It reads the header and writes the trace id on its JSON audit lines (executor/app/main.py):
TRACEPARENT = re.compile(r"^00-([0-9a-f]{32})-[0-9a-f]{16}-[0-9a-f]{2}$")

def trace_id_of(request: Request) -> str | None:
    m = TRACEPARENT.match(request.headers.get("traceparent", ""))
    return m.group(1) if m and m.group(1) != "0" * 32 else None
That is log correlation, not distributed tracing: the executor's work shows up in Loki next to the site's lines, not as spans in Jaeger.
Useful, safe span names
@vercel/otel names outgoing calls after the full URL, which put R2 object keys and query strings into span names. A small processor renames them when they start:
onStart(span) {
  const m = /^(http|fetch) ([A-Z]+) (.*)$/s.exec(span.name);
  if (m) span.updateName(`${m[1]} ${m[2]} ${outboundHost(m[3]!)}`);
},
http GET https://<account>.r2.cloudflarestorage.com/<bucket>/<key>?x-id=GetObject becomes http GET r2.cloudflarestorage.com. The collector then removes URL, query, client address, SQL and exception attributes and drops exception span events (tools/…/otel-collector/collector.yaml). A failed span keeps its status and error.type, never the error message.
7. How logs and traces are correlated
One id ties a request together:
- The proxy runs inside Next's request span, so the access line, the app's own lines, the completion line and every span share one
traceId. - When something fails unexpectedly, the visitor sees a reference. For API routes it is
{"error": "Something went wrong…", "code": "internal", "reference": "<trace id>"}; admin and account forms end the message withReference: <trace id>. Error pages show Next's digest, which is also on therequest_failedline aserror_code. - In Grafana, the Loki data source has a derived field that turns
trace_id=<32 hex>into a link to the trace in Jaeger. The link points atlocalhost:16686, so it works only with the port-forward running. Jaeger 2.x no longer serves the older query API that Grafana's Jaeger data source uses, so Grafana has no Jaeger data source.
8. Metrics, dashboards and alerts
The app serves Prometheus metrics on a second port, 9464, which is not in the public Service; the NetworkPolicy admits only the Prometheus pod to it. Request metrics are built from Next's own server spans:
http_server_requests_total{method, route, status}, withroutethe pattern andstatusa class (2xx…5xx), so a few dozen series cover the whole site;http_server_request_duration_secondswith buckets from 25 ms to 10 s;- process memory, CPU, heap and event-loop delay,
jithendar_build_info{version}, and a few site gauges read from the database every 30 s (published posts, pending comments, failed jobs).
route="other" collects requests without a route, mostly static files and the image optimizer. The image optimizer fetches /media/[id]/[name] inside the same process, so one optimized image counts as one other request and one /media/[id]/[name] request, in the same trace.
Two dashboards are provisioned from the tools repository: Jithendar.com · Overview (traffic, errors, latency, busiest and slowest routes, pod resources) and Jithendar.com · Logs (log volume, errors by type, and a Failed or slow requests list with trace ids).
Some of the queries behind them:
# Requests per second, without health probes
sum(rate(http_server_requests_total{job="jithendar-com", route!="/api/health"}[5m]))

# Slowest routes (p95)
topk(8, histogram_quantile(0.95, sum by (le, route) (rate(http_server_request_duration_seconds_bucket{job="jithendar-com", route!~"other|/api/health"}[10m]))))
The alert rules (tools/deploy/minikube/observability/prometheus/files/alerts.yml) cover the site and the pipeline that watches it:
- alert: JithendarComHighErrorRatio
  expr: |
    (
      sum(rate(http_server_requests_total{job="jithendar-com", route!="/api/health", status="5xx"}[5m]))
        / sum(rate(http_server_requests_total{job="jithendar-com", route!="/api/health"}[5m]))
    ) > 0.05
    and sum(increase(http_server_requests_total{job="jithendar-com", route!="/api/health", status="5xx"}[5m])) >= 3
  for: 5m
The second condition stops one failed request on a quiet night from counting as "100 % errors". Next to it are JithendarComDown, JithendarComSlow (p95 over 2 s for 10 minutes), ObservabilityTargetDown, LogShippingDropped, TraceSpansLost and JaegerMemoryNearLimit. Each has a runbook_url pointing at a short runbook in www/docs/OBSERVABILITY.md or the tools observability README.
9. An investigation: one slow request
On 4 November 2026, the Failed or slow requests query in section 5 returned this line:
event=http_request_completed level=info route=/api/admin/images/generate method=POST status=200 duration_ms=11861 outcome=success trace_id=e45c6cafc2606df636a9ee757f539e2dNearly 12 seconds, but status 200. Searching for the trace id returned three lines: the access line, the completion line and an image_generated event. So the request worked and produced a cover image. The question was where the 12 seconds went.
The trace in Jaeger had 17 spans. The ones longer than 20 ms, with start times relative to the request:
| Starts at | Duration | Span |
|---|---|---|
| 4 ms | 11,861 ms | POST /api/admin/images/generate |
| 146 ms | 11,718 ms | executing api route (app) /api/admin/images/generate |
| 180 ms | 10,402 ms | fetch POST https://generativelanguage.googleapis.com/v1beta/interactions |
| 10,596 ms | 1,256 ms | r2.PutObject |
About 10.4 seconds were the call to Google's Gemini API that generates the image, and 1.3 seconds were uploading the result to R2. Nothing in the site's own code was slow. This is an admin-only action, so the right response is to make the wait visible in the admin UI, not to tune the server. It also does not trip JithendarComSlow, which looks at the p95 across all routes.
The trace also showed one of the gaps from section 10: the R2 upload had a child span named after the full object URL. After the fix, that name is http PUT r2.cloudflarestorage.com.
10. Gaps the review found, and what changed
The review compared the code with what the live cluster was doing. Everything below was observed on mk4 on 4 November 2026.
| Gap | Evidence | Fix |
|---|---|---|
| Health probes filled the trace store | The 40 newest site traces in Jaeger were all /api/health (8 spans each); about 1,080 of roughly 2,250 requests in an hour were probes | The sampler drops probe traces at the source; the proxy writes no access line for them; dashboards and alerts leave them out |
| Jaeger ran out of memory | OOMKilled, 11 restarts, at 235 Mi of a 256 Mi limit; the in-memory store has no limit by default | Explicit config with max_traces: 5000 and a 384 Mi limit, plus JaegerMemoryNearLimit |
| Visitors could choose the trace id | A request sent with a made-up traceparent was logged and traced under that id | Traefik strips trace headers; the sampler ignores remote sampling flags |
| URLs in span names | http GET https://<account>.r2.cloudflarestorage.com/…/<key>?x-id=GetObject, and a 95 kB fetch GET data:… name from the OG image renderer | Names reduced to method and host; resource.name is the host; data: URLs not traced |
| Route and outcome lost in Loki | Alloy's route pattern had no [ or ], so /blog/[slug] and every other dynamic route was dropped; only outcome=success passed | Both patterns widened, in the mk4 config and its EKS copy |
| Reset tokens could reach the logs | Better Auth's link is /api/auth/reset-password/<token>; the access line logged the raw path (kept by Alloy), and request_failed logged it as path | loggedPath() writes /api/auth/reset-password/:token (and /preview/:token). No such line was in the last 72 hours of pod logs |
| Log loss went unnoticed | Alloy dropped 541,189 lines on 2 November after Loki answered 500 Ingester is shutting down | LogShippingDropped alert |
| The collector could not be monitored | Its metrics port refused connections from other pods | Listener on 0.0.0.0:8888, Prometheus jobs otel-collector and jaeger, TraceSpansLost alert |
| Probes diluted the alerts | Half of all requests were fast, successful probes | route!="/api/health" in the ratio and latency rules, and at least 3 failures before the error alert |
11. Sampling, retention, cardinality, privacy and cost
Sampling. Every request except health probes is traced. That is affordable because traffic is small, and it means every completion line has a trace behind it. If traffic grows, the sampler is the place to add ratio sampling. Request metrics come from the spans, so the metrics would have to be built differently first.
Retention.
| Store | Kept for | Setting |
|---|---|---|
| Loki | 7 days | retention_period: 168h |
| Prometheus | 7 days or 4 GB | retentionTime, retentionSize |
| Jaeger | newest 5000 traces, lost on restart | max_traces |
| Pod stdout | until kubelet rotates it | full lines with messages and stacks |
Traces are the shortest-lived signal by design: an investigation starts from a log line or an alert, and the trace needs to exist only for hours.
Cardinality. Metrics use route patterns, status classes and a fixed method list, and any route longer than 120 characters or not starting with / becomes other. Loki labels are limited to the six listed in section 5.
Privacy. Three layers, each assuming the one before can fail: the app does not log secrets and removes tokens from paths; Alloy keeps only allowlisted fields with strict patterns; the collector removes URLs, SQL, addresses and exception text from spans. IP addresses and user agents are on the access line in the pod but never reach Loki.
Cost. Everything runs inside the existing cluster, so the cost is CPU, memory and disk: the collector is limited to 256 Mi, Jaeger to 384 Mi, Prometheus has a 5 Gi volume and Loki a 4 MB/s ingestion limit. There is no paid observability service.
12. Deploying, verifying and troubleshooting
Deploy
- Site: push the code so CI builds the image, then run
./deploy.shfrom the repository root. It appliesk8s/, including the newstrip-trace-headersmiddleware, and restarts the Deployment. tools: push, then syncloki,prometheusandgrafanain Argo CD.- Collector and Jaeger have no Argo CD Application:
kubectl apply -k deploy/minikube/observability/otel-collectorandkubectl apply -k deploy/minikube/observability/jaeger. Jaeger restarts with an empty store.
Rollback: kubectl rollout undo deployment/<name> -n <namespace> for the site, collector or Jaeger; kubectl delete middleware strip-trace-headers -n jithendar after re-applying the old Ingress annotation; revert the commits in tools and sync again.
Verify
# 1. Probes are no longer traced (empty after the new pods have run for a minute)
kubectl -n observability port-forward svc/jaeger 16686 &
curl -s "localhost:16686/api/v3/operations?service=jithendar-com" | grep -c '/api/health'

# 2. A client traceparent is ignored: the logged trace id is not the one sent
curl -s -o /dev/null https://jithendar.com/robots.txt -H "traceparent: 00-0af7651916cd43dd8448eb211c80319c-b7ad6b7169203331-01"
# then in Loki: {namespace="jithendar"} |= "0af7651916cd43dd8448eb211c80319c"  → no lines
Then, in Grafana: completion lines for /blog/[slug] carry route=; Prometheus → Status → Targets shows jithendar-com (2 targets), otel-collector and jaeger up; Prometheus → Alerts shows all rules loaded.
Before deploying, I checked what I could locally. The production build, run with a capture endpoint, sent no spans for /api/health and still traced a request that carried a -00 traceparent. With the collector address pointing at a closed port, 20 requests in a row returned 200 in 2 to 37 ms. A reset-password URL appeared in the logs only as /api/auth/reset-password/:token. The site's 448 unit tests, the executor's 19 tests and the tools repository's 241 tests passed, and every alert expression evaluated on the live Prometheus.
Common failures
- No traces at all. Check
OTEL_EXPORTER_OTLP_ENDPOINTin the pod and thetracing_enabledline at startup, thenotelcol_receiver_accepted_spanson the collector. The NetworkPolicy allows egress to the collector on port 4318 only. - Traces disappear after a while. Jaeger is in memory: a restart or the 5000-trace limit removes old ones. Look at
JaegerMemoryNearLimitand the pod's restart count. - A field is in
kubectl logsbut not in Loki. Alloy drops any field that is not allowlisted or does not match its pattern. Check the pattern inconfig.alloybefore changing the app. - Grafana's trace link does nothing. Start the port-forward first; the link points at
localhost:16686. - Request counts look doubled for images. That is the image optimizer described in section 8.
13. Limitations and planned improvements
What the setup does not do today:
- No database or Redis spans. Drizzle's built-in tracing would put SQL and parameters on spans, and postgres.js has no safe hook. Time spent in SQL shows as a render span with no children.
- The executor is not traced, only correlated through its log lines. Its queue and sandbox pods are invisible in Jaeger.
- No delivered alerts. Without Alertmanager, someone has to look at Prometheus.
- No browser telemetry. Front-end errors and page timings are not collected.
- Traces are short-lived and Jaeger is reachable only by port-forward.
- Resource attributes still say Vercel.
@vercel/oteladdscloud.provider: vercelby default, although the site runs on minikube. - Spans of the last few seconds before a pod stops can be lost, because nothing flushes the exporter on shutdown.
/metricsrelies only on the NetworkPolicy. AMETRICS_TOKENsecret exists, but no code checks it.
Possible next steps, none of them started: Alertmanager with one notification channel, persistent trace storage if traffic justifies it, an OpenTelemetry SDK in the executor and dispatcher, and a privacy-reviewed browser error reporter.

Discussion comments
No comments yet. Start the discussion.